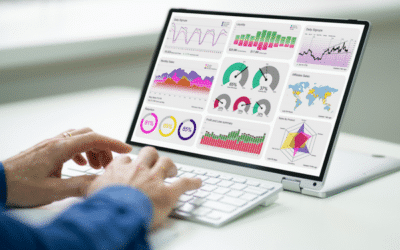
An essential management tool, the dashboard gives executives rapid, comprehensive access to the data they need to make decisions.
Much more than a simple table, the dashboard often brings together different visuals (graphs, tables, etc.) to track KPIs (Key Performance Indicators).
The dashboard, a necessary management tool
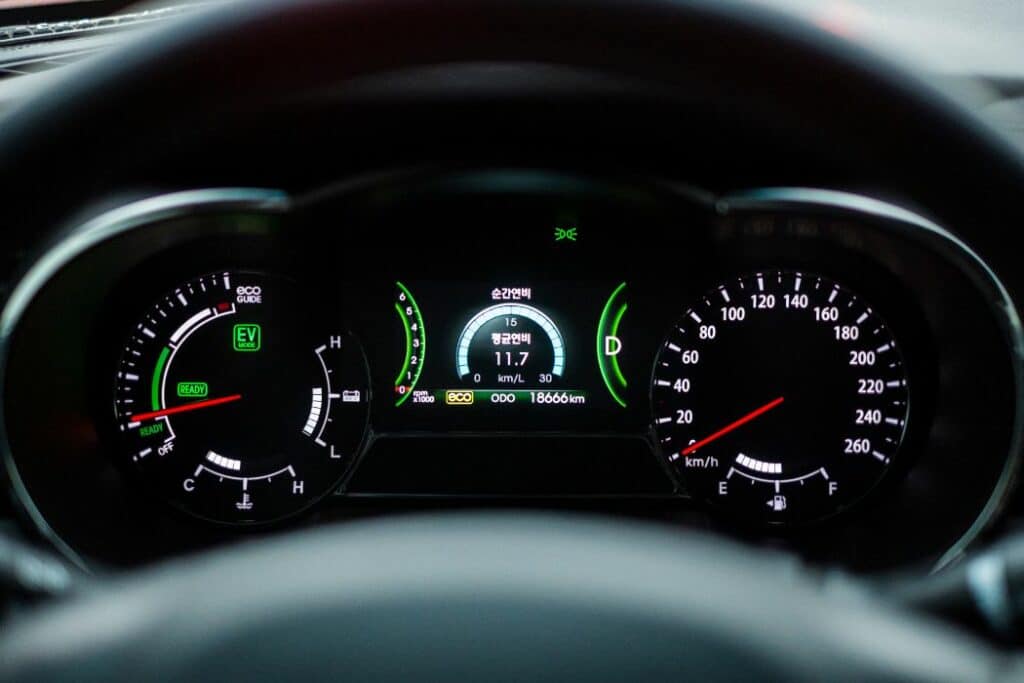
Running a company without a dashboard is like piloting an airplane without navigation tools: you have no idea where you stand, you don’t know where you’re going, and you’re totally blind to potential problems.
This didn’t stop the aviation pioneers or the first industrialists of the 19th century, but today it’s absolutely inconceivable.
For complete and effective management control, there are 3 types of dashboards:

Operational dashboard
A short-term management tool, it enables you to manage the progress of action plans and ensure the smooth day-to-day running of your business.
Examples of indicators :
- Order book
- Delivery time
- Project follow-up
The management dashboard
This is the management control tool par excellence, whose aim is to compare reality with budget forecasts. It enables the company to be managed over the medium term.
Examples of indicators :
- Sales figures
- Stock value
- Absenteeism
The strategic dashboard (balanced scorecard)
In order to implement a long-term strategy, this dashboard must analyze the parameters essential to the company’s good health. The whole must be coherent and precise, so that the right decisions can be made.
Examples of indicators :
- Margin and profit
- Customer satisfaction
- Total payroll
A useful dashboard for the company
To be truly effective, a dashboard must take into account the specific characteristics of the company and be based on reality.
Performance indicators tailored to your company
Of course, many KPIs are common to all companies (sales, salaries, etc.), but each sector and each company operates differently. For effective management, its particular features must be reflected in the dashboard.
The choice of indicators is therefore a crucial stage, requiring the involvement of various departments, as well as external consultants.
Correct, up-to-date data
It goes without saying that dashboard information must be real and up-to-date. Making decisions based on erroneous or outdated figures is the best way to lead your business to disaster!
Yet this has long been one of the main problems with dashboards:
- Numbers entered manually may be embellished, or fall victim to input errors.
- Data collection is time-consuming and analysis tedious. The indicators on the dashboard are likely to show a past situation that is several months old.
- Updating dashboards is time-consuming and resource-intensive.
New technologies, the digitization of processes and the advent of Business Intelligence solutions make dashboards powerful, reliable and accessible to SMEs.

BI solutions for effective management control
The benefits of Business Intelligence software for your company are numerous. They offer considerable gains in efficiency and precision, thanks to their automatic reporting capabilities.
Reliable information
BI solutions access data directly. Their integration, homogenization and restitution is fully automated, avoiding any human error.
Consequently, the figures presented in the dashboard correspond in every respect to reality. This enables a precise analysis, so you can make the best decision.
Real-time results
Business Intelligence gathers information automatically and instantaneously. The computing power of the algorithms used means that data processing is immediate. Updating a dashboard therefore only takes a few seconds.
This enables decision-makers to accurately monitor the company’s progress and instantly implement any corrective actions required.
An infinite number of performance indicators
By definition, a dashboard should have a limited number of KPIs, so as to remain clear and easily comparable. However, it may occasionally be necessary to analyze a specific point in greater detail, in order to identify a bottleneck or an area for improvement.
Before the advent of Business Intelligence solutions, this required the mobilization of many resources and was time-consuming.
Today, software such as Qliksens(https://www.qlik.com/fr-fr/), Power Bi(https://powerbi.microsoft.com/fr-fr/), Tableau(https://www.tableau.com/fr-fr) and many others allow you to quickly obtain this information via queries.
Similarly, Process Mining algorithms can be used to analyze company processes to pinpoint bottlenecks. The data can then be included in reports for corrective action.
BI makes management control easier
Implementing a Business Intelligence solution will undoubtedly make it easier for you to manage and steer your company. You’ll have access to precise, up-to-date dashboards, with a wide range of indicators at your disposal.
Choosing and implementing Business Intelligence software usually requires the support of a partner.
The Altermès teams are made up of finance and business experts with many years’ experience in management control, business intelligence, data analysis and corporate digitalization. We’re here to listen to you, to propose different solutions adapted to your company’s reality, and to help you implement them.
👆 Want to know what the best BI and data visualization tools are!
📞You’d like to implement high-performance management dashboards within your company, contact us!
🔎Find out more about ourinnovative technology solutions for finance departments!


